Quantitative Risk Approach
Quantitative risk management represents a structured attempt to understand uncertainty using numerical techniques, probability theory, and statistical modeling. Within the ISO 31000 framework, quantitative analysis does not replace judgment or qualitative assessment, but enhances decision-making where uncertainty can be reasonably measured.
Organizations typically apply quantitative methods when risk exposure is material, decisions are irreversible or long-term, and outcomes can be expressed in measurable terms such as financial loss, schedule delay, or capacity impact.
1. Expected Value (EV)

Expected Value is one of the most fundamental quantitative risk concepts. It represents the probability-weighted average of all possible outcomes. While deceptively simple, it forms the foundation of many advanced risk and decision models.
In practical terms, Expected Value answers the question: “If this uncertain situation were repeated many times, what would the average outcome be?” This makes it particularly useful for comparing alternatives that involve trade-offs between risk and reward.
Expected Value is widely used in project risk analysis, investment appraisal, insurance pricing, and operational decision-making. However, it must be interpreted carefully: two options can have the same expected value but very different risk profiles.
From a governance perspective, Expected Value should be used alongside risk appetite and tolerance considerations. A decision with positive expected value may still be unacceptable if potential downside exceeds organizational tolerance.
2. Sensitivity Analysis

Sensitivity analysis examines how changes in individual input variables affect an outcome, holding other factors constant. Its primary objective is not prediction, but understanding influence and vulnerability.
In risk management practice, sensitivity analysis helps identify “risk drivers” — variables that disproportionately affect outcomes. This insight allows organizations to focus mitigation, controls, and monitoring efforts on the most critical assumptions.
Tornado diagrams are commonly used to visualize sensitivity results, ranking variables by their impact. These visuals are especially effective in executive and board-level discussions, where clarity and prioritization are essential.
Sensitivity analysis is most valuable in early planning stages, when assumptions are uncertain and decisions are still flexible. It is often used as a precursor to more advanced simulation techniques.
3. Scenario Analysis

Scenario analysis evaluates outcomes under a set of internally consistent assumptions representing different possible futures. Unlike sensitivity analysis, which isolates variables, scenario analysis considers how multiple factors may interact.
Scenarios are often framed as best-case, base-case, and worst-case outcomes, but more sophisticated applications may involve macroeconomic, geopolitical, climate, or regulatory scenarios.
Scenario analysis plays a critical role in strategic planning, enterprise risk management, and regulatory stress testing. It supports resilience by helping organizations anticipate and prepare for uncertainty beyond historical experience.
Importantly, scenario analysis encourages structured thinking about uncertainty and avoids false precision. It is as much a communication and learning tool as it is a quantitative technique.
4. Monte Carlo Simulation
Monte Carlo simulation represents one of the most powerful tools in quantitative risk analysis. Rather than relying on single-point estimates, it models uncertainty by running thousands (or millions) of simulations using probability distributions.
The output of a Monte Carlo simulation is not a single number, but a distribution of possible outcomes. This allows decision-makers to understand likelihood, confidence levels, and tail risks.
Monte Carlo simulation is widely used in portfolio risk management, capital projects, energy markets, insurance, and quantitative finance. It is especially useful when multiple uncertain variables interact in non-linear ways.
However, Monte Carlo results are only as reliable as the assumptions and input distributions used. Governance, transparency, and expert judgment are essential to avoid false confidence.
5. Value at Risk (VaR)
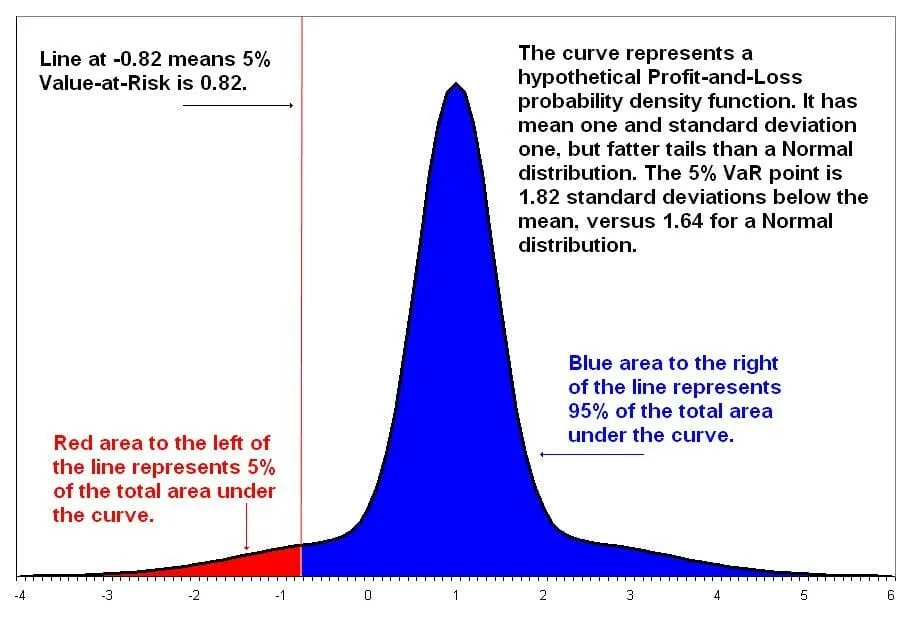
Value at Risk (VaR) estimates the maximum expected loss over a specified time horizon at a given confidence level. It has become a standard risk metric in financial institutions and regulatory frameworks.
VaR is attractive because it condenses complex risk exposure into a single, communicable number. This makes it useful for senior management, regulators, and risk committees.
Despite its popularity, VaR has limitations. It does not describe losses beyond the confidence threshold and can underestimate tail risk if distributions are mis-specified.
Best practice requires VaR to be complemented by stress testing, scenario analysis, and qualitative judgment.
6. Stress Testing

Stress testing evaluates the impact of extreme but plausible adverse events on an organization’s financial, operational, or strategic position. Unlike probabilistic models, stress testing focuses on severity and resilience rather than likelihood.
It is widely used by regulators, financial institutions, and boards to assess preparedness for systemic shocks, economic crises, or operational disruptions.
Effective stress testing challenges assumptions, exposes vulnerabilities, and supports contingency planning. It is a critical complement to quantitative models that rely on historical data.
Perspective
Quantitative risk methods enhance understanding of uncertainty, but they do not eliminate it. When applied responsibly — in alignment with ISO 31000, sound governance, and professional judgment — they significantly strengthen risk-informed decision-making in corporate objectives.